Nonprofit Chart of Accounts: Sample Structure and Examples
See a sample nonprofit chart of accounts with numbering, funds, and examples for churches, plus tips for structuring accounts around restricted gifts.
Think of a chart of accounts as the financial filing cabinet for your nonprofit. It’s a complete list of every single account in your financial system, organized to give you a crystal-clear picture of how money moves through your organization. Every dollar from donations, grants, and programs gets its own designated folder, which is the key to maintaining clarity, accountability, and compliance.
About Grain Ledger: This guide includes Grain Ledger, church fund accounting software built for designated gifts and ministry funds. It connects giving platforms (Planning Center, Pushpay, Tithely, Stripe), syncs bank activity with Plaid, and produces fund-level financial reports. Schedule a demo to see how it compares for your church.
See Grain Ledger for your church
Fund accounting, giving integrations, and bank reconciliation in one platform. Free migration support for churches switching from QuickBooks or Aplos.
Your Nonprofit Financial Blueprint
Could you imagine trying to build a house without a blueprint? You might have all the right materials—wood, nails, and concrete—but without a plan showing where everything goes, you’d just end up with a mess. Using a standard, for-profit chart of accounts is a lot like that; it's like trying to build a house with a skyscraper's blueprint. The basic parts are there, but the design is completely wrong for what you actually need.
A chart of accounts for a nonprofit is that essential, purpose-built blueprint for your finances.
It's so much more than a simple list. It’s the strategic framework that sorts every transaction into categories that actually mean something for your mission. This structure becomes the foundation for all of your financial reporting, letting you answer the most important questions with confidence:
- How much did we actually spend on our youth outreach program this quarter?
- Are we properly honoring the restrictions on that big grant we just received?
- Do we have enough unrestricted cash on hand to make payroll next month?
A well-organized COA gives you the clarity you need to build trust with your donors, nail your grant reporting, and file your Form 990 accurately and without stress.
The Five Core Account Types
Every nonprofit chart of accounts, no matter how complex, is built from five fundamental account types. Each one plays a distinct role in telling your organization's financial story. Getting a handle on these pillars is the first step toward building a system that truly works for you.
A thoughtfully designed Chart of Accounts is the bedrock of nonprofit financial management. It transforms raw data into actionable intelligence, enabling leaders to make mission-driven decisions, demonstrate stewardship to donors, and ensure long-term sustainability.
To get started, let’s quickly break down the core components of a nonprofit COA. These five categories form the backbone of your entire financial system, with each assigned a specific number range for easy organization.
| Account Category | Numbering Range (Example) | Purpose and Key Accounts |
|---|---|---|
| Assets | 1000s | What your organization owns. This includes things like cash in the bank, buildings, equipment, and any outstanding pledges from donors. |
| Liabilities | 2000s | What your organization owes. This covers unpaid bills (accounts payable), loans, mortgages, and any grant money received but not yet spent. |
| Net Assets | 3000s | The difference between assets and liabilities, showing your organization's net worth. Crucially, this is split into With Donor Restrictions and Without Donor Restrictions. |
| Revenue | 4000s | All the ways money comes in. This tracks individual contributions, foundation grants, program service fees, and income from fundraising events. |
| Expenses | 5000s+ | How your organization spends money to achieve its mission. These are usually broken down by function: Program Services, Management & General, and Fundraising. |
Understanding how these five pieces fit together is the key to unlocking the full potential of your financial data and using it to drive your mission forward.
How to Build Your Nonprofit COA
Alright, let's move from theory to practice. This is where the rubber meets the road and where financial clarity for your organization really starts to take shape. Designing a chart of accounts for a nonprofit isn't about creating the most complicated spreadsheet you can imagine. It’s about building a logical, scalable framework that mirrors how your organization actually works and tells your financial story in a way everyone can understand.
The backbone of any good COA is a consistent, intuitive numbering system. Think of it like a library's Dewey Decimal System—each number tells you exactly where to find a specific piece of information. This structure keeps your accounts organized, making everything from daily bookkeeping to pulling annual reports much, much easier.
This infographic breaks down the basic hierarchy. You can see how the main account types are like the big drawers in your financial filing cabinet.
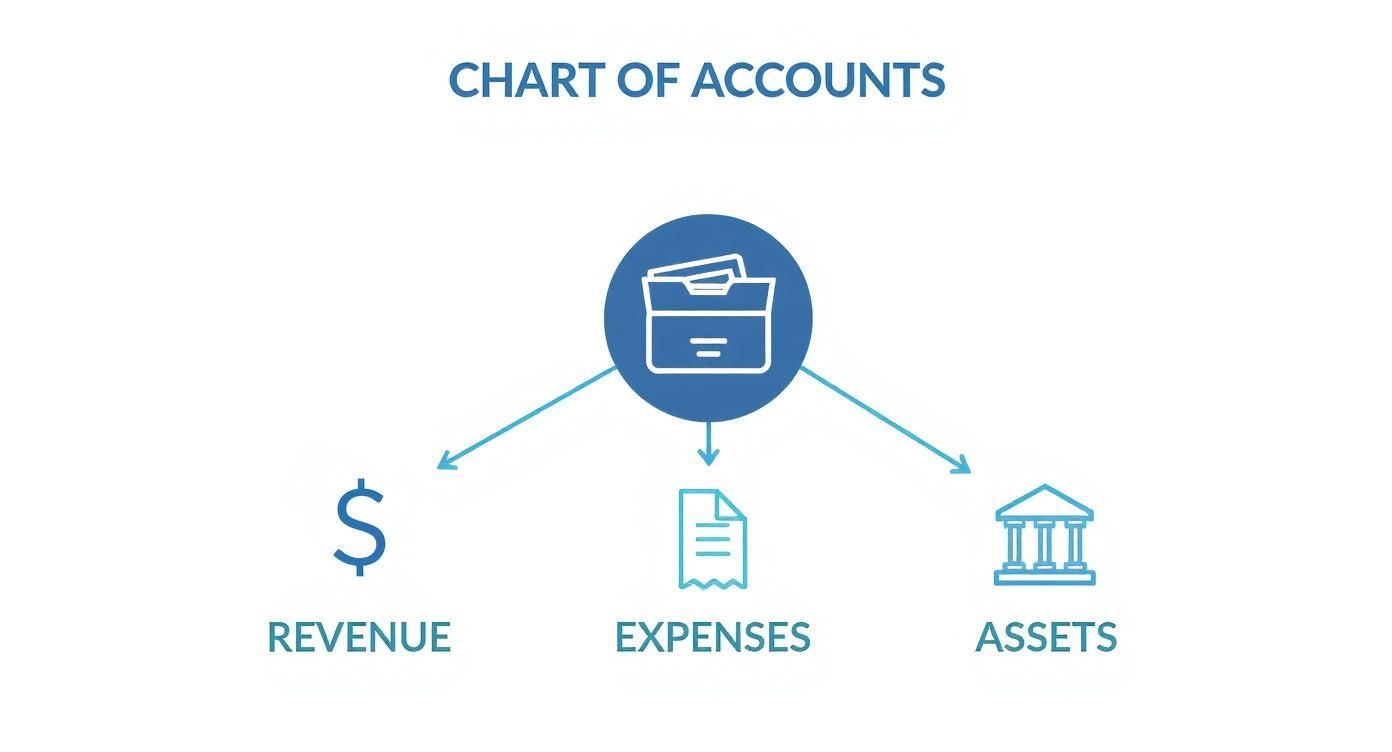
As the visual shows, assets, revenue, and expenses are the main pillars holding up all the financial tracking in your organization's books.
Establishing a Logical Numbering System
One of the most common and effective ways to organize your COA is to assign a block of numbers to each of the five main account types. This simple step creates instant order and makes accounts easy to identify at a glance. You can always customize it, but this standard approach is a fantastic starting point for most small to medium-sized organizations.
- 1000s for Assets: Everything your organization owns.
- 2000s for Liabilities: Everything your organization owes.
- 3000s for Net Assets: Your organization's net worth, broken down by restriction.
- 4000s for Revenue: All the money coming in.
- 5000s+ for Expenses: All the money going out, categorized by what it was for.
Within each of these ranges, you can get more specific with "sub-accounts." For instance, your main 'Cash' account might be 1010. A specific checking account under it could be 1011, and a savings account could be 1012. This layered structure is powerful because it lets you see both the big picture and the tiny details.
Defining Key Nonprofit Accounts
Once you have your numbering system mapped out, it's time to fill it with the accounts that are unique to the nonprofit world. A generic, off-the-shelf business COA just won't cut it—it won't have the right "folders" for tracking things like grants or donor-restricted funds.
Here are a few essential examples for each category.
1. Asset Accounts (1000-1999) Assets are more than just cash in the bank. This section should also capture funds you've been promised and physical items of value.
- 1100 Pledges Receivable: This is where you track legally enforceable promises of donations that haven't hit your bank account yet.
- 1200 Grants Receivable: Similar to pledges, this is for grant money you've been awarded but is still waiting to be paid out.
- 1500 Property & Equipment: This covers the big stuff—land, buildings, vehicles, and computers your nonprofit owns.
2. Liability Accounts (2000-2999) Liabilities represent your financial obligations. Critically, this also includes money you might be holding but isn't technically yours to spend yet.
- 2100 Accounts Payable: Your standard account for keeping track of unpaid bills from suppliers and vendors.
- 2400 Deferred Revenue: This is crucial for grants paid upfront. You have the cash (an asset), but it's also a liability until you've done the work or met the grant's requirements.
3. Net Asset Accounts (3000-3999) This is the real heart of nonprofit accounting. These accounts are where you clearly separate funds based on what donors intended.
- 3100 Net Assets Without Donor Restrictions: This is your general operating fund, money that can be used for any purpose that supports your mission.
- 3200 Net Assets With Donor Restrictions: These are funds a donor has earmarked for a specific project (like a new building) or a certain time period.
Adopting a standardized framework isn't just a good idea; it's a proven strategy. The Unified Chart of Accounts (UCOA) has done wonders for financial transparency in the sector. A 2020 survey found that over 65% of U.S. nonprofits now use a structured COA system. The result? A 30% reduction in errors on their IRS Form 990 filings. That’s a huge win for staying compliant and keeping donor trust. You can dig into the findings of how standardized COAs impact nonprofit reporting on SuccessfulNonprofits.com.
Structuring Expenses for Form 990
This might be the most important part of building your nonprofit COA: how you structure your expense accounts. The IRS wants to see your expenses reported by their functional classification. This is just a formal way of saying they want to see how you're actually using your money to achieve your mission.
Your expense structure should directly map to the three main categories on the Form 990: Program Services, Management & General, and Fundraising. Getting this right from the start makes tax time infinitely easier.
The best way to do this is by creating parent expense accounts for each functional area. Then, you can nest the specific, or "natural," expenses underneath them. It looks something like this:
- 5000 Program Services Expenses: Costs that are directly tied to carrying out your mission.
- 5010 Program Staff Salaries
- 5020 Program Supplies
- 5030 Program Travel
- 6000 Management & General Expenses: The overhead costs that keep the lights on and support the whole organization.
- 6010 Administrative Salaries
- 6020 Office Rent & Utilities
- 6030 Insurance
- 7000 Fundraising Expenses: Any costs you incur to bring in donations.
- 7010 Development Staff Salaries
- 7020 Fundraising Event Costs
- 7030 Direct Mail & Marketing
This clear-cut structure helps you build a COA that’s detailed enough for precise tracking but simple enough for anyone on your team to understand and use.
Bringing Fund Accounting to Life with Your COA
When it comes to nonprofit finance, fund accounting is the name of the game. Your chart of accounts is what makes it all work. While for-profit businesses are laser-focused on the bottom line, your world is all about a different kind of accountability—to your donors, to grantors, and to the community you serve. You're tasked with using every dollar exactly as it was intended.
This is where a chart of accounts for nonprofit organizations becomes your most powerful tool, letting you practice fund accounting with total clarity.

I like to think of fund accounting like managing a series of digital envelopes. Each "envelope" is a separate fund set aside for a specific purpose. When a donation arrives, it doesn't just get tossed into one big pile of cash. Instead, it’s carefully placed into the correct envelope. Your COA is the system that creates, labels, and keeps all those envelopes perfectly organized.
Keeping Track of Net Assets by Restriction
The single most important job of fund accounting is to separate your net assets based on any restrictions a donor has placed on their gift. This isn't just a "nice-to-have" bookkeeping practice; it's a legal and ethical requirement. Your COA has to be built to track these categories separately, which is typically handled in the 3000s range of account numbers.
You’ll be managing two main categories:
- Net Assets Without Donor Restrictions: This is your general operating fund. Think of it as your most flexible envelope, holding money that can be used for anything that supports your mission, whether it's keeping the lights on or launching a new outreach program.
- Net Assets With Donor Restrictions: This category is for all the funds that donors have specifically earmarked for a certain purpose, project, or time frame. A detailed COA is absolutely essential here to maintain compliance and keep the trust of your supporters.
These restricted funds can get even more granular. Some restrictions are temporary (like funds for next year's summer camp), while others are permanent (like an endowment where you can only spend the investment income, not the principal).
How Fund Tracking Works in the Real World
Let's walk through how this looks on a practical level. Imagine three different checks arrive in the mail on the same day. A well-structured COA gives you the power to direct each one to its proper digital envelope.
- A General Donation: Someone gives $100 with a simple note that says, "Use it where it's needed most." You'd record this revenue under an account like 4100 - Individual Contributions, and it would increase your 3100 - Net Assets Without Donor Restrictions.
- A Program-Specific Grant: You receive a $5,000 grant that is strictly for your youth ministry's summer camp. That revenue gets coded to a more specific account, like 4210 - Youth Program Grants, and it increases a designated fund like 3210 - Net Assets With Donor Restrictions (Youth Camp).
- An Endowment Contribution: A founding member leaves $25,000 in their will to establish a permanent endowment. This would be recorded in an account like 4300 - Endowment Contributions and increase 3250 - Net Assets With Donor Restrictions (Permanent Endowment).
Without a COA built for fund accounting, these very different streams of income would just blur into a single number, making it impossible to report on them accurately. This clean separation is the foundation for trustworthy financial statements. You can see how this structure flows into your reports in our guide to church financial reporting, which is built on these same core principles.
The Steep Price of Getting It Wrong
Failing to track restricted funds isn't just a small bookkeeping mistake—it can have serious consequences that put your organization's reputation and financial health at risk.
Mismanaging donor-restricted funds is one of the quickest ways to erode trust. When donors believe their specific intentions are not being honored, they are far less likely to give again, jeopardizing future funding.
The potential fallout can be devastating:
- Loss of Donor Trust: If a donor finds out the money they gave for a new building was used to cover payroll, that relationship is probably broken forever.
- Legal and Audit Issues: Misusing restricted funds can lead to legal action from donors and major red flags during an audit, which can tarnish your public image.
- Grant Funding Risk: Grantmakers demand meticulous reports. If you can't prove you spent their money according to the agreement, they might ask for it back and will almost certainly deny future requests.
Your chart of accounts is your first and best line of defense. By setting it up the right way from day one, you build a rock-solid system of accountability that protects your organization and honors the generosity of every person who supports your mission.
A Practical Chart of Accounts for Your Nonprofit or Church
All the theory in the world is great, but sometimes you just need to see how it all fits together. To help bridge that gap, we've put together a sample chart of accounts for nonprofit organizations and churches. Think of it as a solid blueprint you can build upon.
This template is designed for small to medium-sized organizations and is structured to make your Form 990 reporting much easier. But remember, this is a starting point, not a straitjacket. Your mission is unique, so feel free to add, remove, or rename accounts to perfectly match what you do.
Let's walk through a common, adaptable structure that works for a typical small nonprofit or church. The table below lays out a detailed template, showing how standard account numbers and names work together to create a clear financial picture.
Example Nonprofit Chart of Accounts Template
| Account Number | Account Name | Account Type | Description/Use Case |
|---|---|---|---|
| 1010 | Operating Checking Account | Asset | Your main bank account for daily income and expenses. |
| 1550 | Equipment (at cost) | Asset | The value of significant items like computers, vehicles, or A/V gear. |
| 1650 | Accumulated Depreciation | Asset | A contra-asset that tracks the depreciation of your equipment and buildings over time. |
| 2010 | Accounts Payable | Liability | Short-term bills you owe to vendors (e.g., your utility or curriculum provider). |
| 2400 | Deferred Revenue | Liability | Grant or donation money received before the expense it's intended to cover has occurred. |
| 3100 | Net Assets Without Donor Restrictions | Net Asset | Your general fund. Flexible dollars you can use for any part of your mission. |
| 3200 | Net Assets With Donor Restrictions | Net Asset | Funds designated by a donor for a specific purpose, like "Youth Camp" or "Building Fund." |
| 4010 | Tithes and Offerings | Revenue | General, unrestricted donations from your congregation or members. |
| 4200 | Foundation Grants | Revenue | Income received from private or community foundations for specific programs. |
| 4500 | Program Service Fees | Revenue | Money earned from services, such as class fees, counseling sessions, or event tickets. |
| 5110 | Program Staff Salaries & Benefits | Expense | Payroll costs for staff who directly carry out your mission-focused programs. |
| 6210 | Rent & Utilities | Expense | Overhead costs for your office or facility space. |
| 6300 | Professional Fees | Expense | Costs for outside experts like your accountant or lawyer. |
| 7220 | Fundraising Event Expenses | Expense | The direct costs associated with a fundraising event, like venue rental or catering. |
This template gives you a robust framework to get started. Don't feel pressured to use every single account—the goal is clarity, not overwhelming complexity.
A Deeper Look at the Account Categories
Let's break down those account types in a little more detail.
Asset Accounts (1000-1999)
Assets are everything your organization owns that has value. The numbering usually starts with your most "liquid" assets—like cash in the bank—and moves to things that are harder to turn into cash, like buildings.
- 1010 Operating Checking Account: This is your workhorse account for daily deposits and payments.
- 1100 Pledges Receivable: This account tracks promised donations that haven't hit your bank account yet.
- 1510 Buildings: The value of any property you own.
Liability Accounts (2000-2999)
Liabilities are simply what you owe to others. Think of it as the opposite of assets. This includes everything from unpaid invoices to outstanding credit card balances.
- 2010 Accounts Payable: A temporary holding spot for all your unpaid vendor bills.
- 2100 Credit Card Payable: The balance you owe on your organization's credit card.
- 2400 Deferred Revenue: Super important for grants! This is where you park funds you've received for a project you haven't started yet.
A well-structured chart of accounts acts as your organization’s financial DNA. It provides the unique code that defines every transaction, ensuring each dollar is classified correctly and reports back to its intended purpose.
Net Asset Accounts (3000-3999)
This is where the magic of nonprofit accounting really happens. This section is where you separate your money based on what donors have told you to do with it, which is essential for proving you're a good steward of their gifts.
- 3100 Net Assets Without Donor Restrictions: Your general operating fund. It’s flexible and can be used for any purpose that supports your mission.
- 3200 Net Assets With Donor Restrictions: Funds that a donor has earmarked for a specific program (like the Youth Ministry) or a future time period.
- 3300 Net Assets With Donor Restrictions (Permanent): This is for endowments. You can't touch the original gift (the principal), but you can spend the investment income it generates.
Revenue Accounts (4000-4999)
These accounts track every dollar that comes in. It’s smart to have separate accounts for your major income streams so you can easily see where your support is coming from.
- 4010 Tithes and Offerings: The bread and butter for many churches—general, unrestricted gifts.
- 4200 Foundation Grants: Income from grants awarded by private or community foundations.
- 4600 Fundraising Event Income: The total (gross) income you bring in from events like galas or bake sales.
Expense Accounts (5000 and up)
How you categorize expenses is crucial for financial transparency and your Form 990. The gold standard is to group your "natural" expenses (like salaries or rent) under the three main "functional" areas.
- Program Services Expenses (5000s): All costs directly tied to delivering your services and fulfilling your mission. (e.g., 5150 Program Supplies)
- Management & General Expenses (6000s): This is your overhead—the administrative costs that keep the lights on and support the whole organization. (e.g., 6250 Office Supplies)
- Fundraising Expenses (7000s): Any cost directly associated with asking for money. (e.g., 7250 Direct Mail & Marketing Costs)
As you put this into practice, remember that good software makes all the difference. To see which platforms are built for these needs, take a look at our guide on the best church accounting software. The right system will bring this structure to life and make managing your finances a whole lot easier.
Common COA Mistakes and How to Fix Them
A well-designed chart of accounts is one of your most powerful tools for financial clarity. Get it right, and your reporting practically runs itself. But a few common missteps can quickly turn this asset into a source of constant confusion, making month-end a nightmare and audits unnecessarily painful.
Let's walk through the most common pitfalls we see churches and nonprofits fall into and, more importantly, how to sidestep them. Avoiding these errors from the get-go will save you countless hours of cleanup down the road.
Mistake 1: The Overly Complex and Bloated COA
It’s a classic trap. You start with good intentions, creating a new account for every single grant, ministry, and expense type. It feels organized at first, but this path almost always leads to a bloated, unmanageable COA that nobody on the team can navigate. The more accounts you have, the more room there is for error and the more time you'll waste just trying to find the right code.
This isn't just a feeling; it's a trend. Back in 2000, a typical nonprofit COA might have had 150–200 accounts. Fast forward to 2023, and it's not uncommon to see that number swell to 400–600 for a mid-sized organization. That complexity comes at a real cost. A recent report found that a staggering 68% of nonprofits with over 500 accounts faced major challenges in reporting and audit prep. You can dig into the modern nonprofit COA findings at GRFCPAs.com to see the data for yourself.
The Fix: Start simple and stay disciplined. The goal of a COA is clarity, not clutter.
- Use Classes or Tags: Instead of creating a dozen different expense accounts like "5150 - Youth Group Supplies," "5151 - VBS Supplies," and "5152 - Mission Trip Supplies," create one general account: "5150 - Program Supplies." Then, use classes or tags in your accounting software to specify which ministry the expense belongs to. This keeps your COA lean while giving you powerful, detailed reporting.
- Establish a "Gatekeeper": Designate one person—maybe the treasurer or bookkeeper—who has the final say on adding any new accounts. This simple step prevents the COA from growing out of control with duplicate or unnecessary accounts created on the fly.
- Review It Annually: Set aside time once a year to give your COA a check-up. Are there accounts that haven't been touched all year? Could a few be merged? A little regular maintenance keeps your financial blueprint clean and truly functional.
Mistake 2: Inconsistent Naming and Numbering
Another landmine is a system where account names are vague and the numbering scheme has no real logic. Generic titles like "Miscellaneous Expenses" or "Other Income" inevitably become dumping grounds for transactions that don't have a clear home. When that happens, it's nearly impossible to analyze your spending or income with any real accuracy.
A haphazard numbering system creates similar headaches. If your fundraising expenses are scattered across the 5000s, 6000s, and 8000s, you can't get a quick, cohesive picture of what it actually costs to raise a dollar. Your reports become a jumbled mess.
The Fix: Create clear conventions and write them down.
Think of your chart of accounts as a language your whole team needs to speak. Consistency in naming and numbering ensures everyone is on the same page, from the person entering donations to the board member reviewing the budget.
Here’s how to get everyone speaking the same language:
- Create a COA Manual: This doesn't have to be a novel. A simple document that lists every account number, its official name, and a short description of what it’s for is a game-changer. It’s an invaluable training tool for new volunteers and a go-to reference for everyone else.
- Use Descriptive Names: Be specific. Instead of a generic "Professional Fees," break it down into accounts like "6300 - Accounting Fees" and "6310 - Legal Fees." The clarity is worth the extra moment it takes to set up.
- Stick to Your Numbering Logic: Once you've established your structure, enforce it. If Program Expenses live in the 5000s, make sure all direct program costs are assigned a number in that range. This discipline makes your financial reports instantly intuitive and easy to follow.
Choosing the Right Accounting Tools
Think of your chart of accounts as the blueprint for your church's finances. But a blueprint is just a drawing; you need a good construction crew to bring it to life. That's where the right accounting software comes in.
A well-designed chart of accounts for a nonprofit is powerful, but it can quickly become a tangled mess without tools built for the unique world of fund accounting. You need a system that understands your mission.
Modern accounting platforms designed specifically for churches and nonprofits handle this complexity with ease. Instead of creating hundreds of separate accounts for every single ministry, designated fund, or building project, these systems use features like tags or classes. This approach lets you keep your main chart of accounts lean and clean while still generating incredibly detailed reports on specific programs or campaigns.
This transforms your financial framework from a static list of accounts into a dynamic tool for making strategic decisions. An organized COA has a direct and powerful impact on donor confidence and financial growth. In fact, a 2021 study showed that nonprofits with a clear, well-structured COA were 50% more likely to receive repeat donations from major donors. You can read more about how a structured COA impacts nonprofit fundraising on CharityCharge.com.
The key is finding a system that speaks the language of nonprofit finance right out of the box. To help you evaluate your options, check out our guide on the best accounting software for nonprofit organizations.
Related church accounting software resources
If you are comparing software, these pages map the main decision points: fund accounting, QuickBooks limits, pricing, and migration.
- Best church accounting software (2026 comparison) - canonical guide comparing 12 church accounting platforms
- Church accounting software product page - see Grain Ledger for fund accounting, giving, and bank reconciliation
- Small church accounting software - see the product page built for volunteer treasurers and church admins
- Fund accounting features - review how Grain Ledger tracks designated funds
- QuickBooks for churches - understand workarounds and when to switch
- Free church accounting software - compare free options and upgrade triggers
- Grain Ledger pricing - compare plans for small and growing churches
- Start free - try fund accounting, giving imports, and bank reconciliation together
Frequently Asked Questions
Even with the perfect chart of accounts on paper, questions always pop up once you start putting it into practice. Let's tackle some of the most common ones we hear from church leaders and finance volunteers. This is your go-to guide for those real-world "what do I do now?" moments.
How Often Should I Review My Chart of Accounts?
Think of your chart of accounts less like a stone tablet and more like a living document. It needs to grow and change right along with your ministry. A good rule of thumb is to give it a thorough review at least once a year, usually when you're preparing the annual budget. That's the perfect time to clean house.
This yearly check-in lets you:
- Retire unused accounts that are just cluttering up your reports.
- Add new accounts for that new building campaign or community outreach program.
- Make sure naming is consistent across the board.
Keeping it updated prevents the bloat that turns financial reporting from a useful tool into a confusing chore.
Can I Use Standard QuickBooks for My Nonprofit?
Absolutely. Plenty of churches and nonprofits make standard versions of QuickBooks work for them, but it takes some wrangling. Since it was built for for-profit businesses, you have to find creative ways to handle fund accounting. The secret lies in a feature called "Classes."
You can enable Classes to tag every transaction to a specific fund, program, or grant. So, instead of having a "Youth Ministry Supplies" account and a separate "Food Pantry Supplies" account, you'd have a single "Program Supplies" account. Then, you'd use a class to tag whether the expense was for the youth group or the food pantry. It's a decent workaround, but it all hinges on someone manually tagging every single entry correctly, and there are no built-in guardrails to prevent mistakes.
The real difference is that generic software forces you to simulate fund accounting with add-ons like classes. In contrast, specialized nonprofit platforms are built from the ground up with a fund-native architecture, meaning every dollar is automatically tied to its correct fund by design.
What Is the Difference Between a Fund and a Program?
This is a big one, and it's a point of confusion for so many. Getting this right is foundational for a proper chart of accounts for nonprofit organizations and for reports that actually make sense.
- A Fund is basically a pot of money tied to a specific purpose or restriction. Imagine it as a labeled envelope: "Building Fund," "Mission Trip Fund," or the main "General Operating Fund." Funds tell you where the money came from and how it’s allowed to be used.
- A Program, on the other hand, is what you do. It’s the activity or service that fulfills your mission, like the "After-School Tutoring Program" or "Community Outreach Events." This is where you spend the money.
To put it simply, you raise money into funds and you spend money on programs. Your accounting system needs to clearly track how money from multiple funds might be used to support a single program.
Ready to manage your nonprofit's finances with a system built for your needs? Grain offers true fund-based accounting that aligns your bookkeeping with your ministry's mission. Get clarity on every dollar and confidence in every report. Join the Grain waitlist today.
Ready to simplify your church finances?
Start free with church fund accounting, or watch a product demo first.